Market Signals
Where the 9/21 EMA trend sits on four timeframes at once — 4-hour, daily, weekly and monthly — across every liquid market on the exchange. A market is listed only when at least three of the four agree. Bullish and bearish readings are shown separately, and the entire rule is published below: there is nothing behind it you cannot check yourself.
What the board is leaning toward
Loading the latest snapshot…
Bullish readings (long side)
—Markets where the weight of current evidence leans upward. This list is judged on its own; it is not a ranking against the bearish list below.
Bearish readings (short side)
—Markets where the weight of current evidence leans downward. Acting on a bearish reading usually means shorting or using derivatives — a materially riskier activity than buying, and one that is restricted or unavailable in many countries.
The board is rebuilt at most every 15 minutes and is computed from closed bars, so prices and levels are those of the last build, not live quotes. For live prices use Live Markets.
Position size calculator
The board publishes levels, not sizes — a level set means nothing until it is scaled to your account. This does that arithmetic with numbers you enter. Press Size this on any reading above to load its direction, entry and stop.
—
What the markers mean
Every card carries the same four markers. They describe agreement between timeframes and nothing else — there is no second layer of analysis behind them.
The grade
- SAll four aligned. The 9 EMA sits on the same side of the 21 EMA on the 4-hour, daily, weekly and monthly charts.
- AWeekly and monthly aligned. Three of the four agree, and the two slowest are among them — the higher timeframes set the direction and one faster chart disagrees.
- BThree of four aligned, higher timeframe split. Three agree but one of the two slowest is against, so the longer-term picture is contested.
The supporting markers
- Timeframe agreementHow many of the four timeframes lean the same way as the card, shown as 3 of 4. The bar beneath it is the same figure weighted, since the slower timeframes count for more.
- WeightedThe signed total of the agreeing timeframes: 4-hour counts 1, daily 2, weekly 3, monthly 4, so the range is −10 to +10. It exists to order the list, nothing more. A card at +2 has the three faster charts up and the monthly down; one at +9 has everything but the 4-hour up.
- 9/21 EMA by timeframeThe actual read on each chart — 9 above 21 or 9 below 21 — coloured green where it agrees with the card's direction and red where it does not. A card with one red chip is telling you precisely which timeframe disagrees.
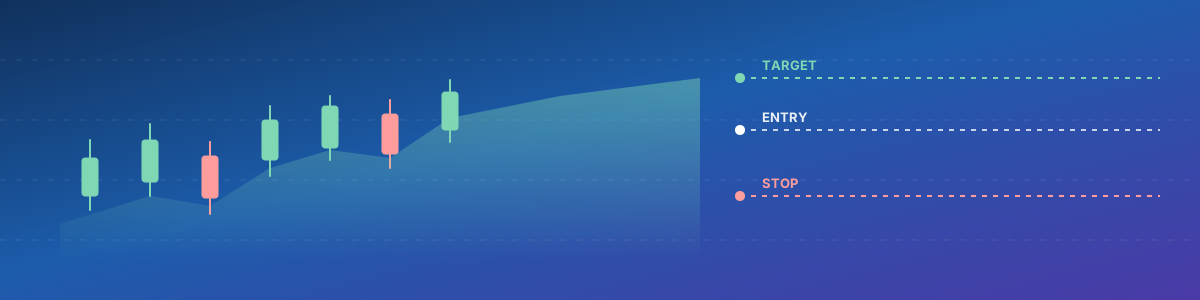
- LevelsEntry is the last price. The stop is the near edge of the EMA band on the 4-hour chart (or the daily one, if the 4-hour band is already broken or sits less than 0.5% away): break it and the alignment the card is built on has ended. Targets are one, two and three times the entry-to-stop distance, so 1R/2R/3R describes the shape of the level set, not a forecast. When the stop is unusually far the card says so.
The whole rule, in full
This board runs one calculation. It is published here in its entirety so you can reproduce every card yourself on any charting platform.
Two moving averages
On each timeframe the board compares a 9-period EMA with a 21-period EMA on closing prices. Nine above twenty-one is an up read; nine below is a down read. That is the entire test.
Four timeframes
The same test runs on the 4-hour, daily, weekly and monthly charts. A market appears on the board only when at least three of the four point the same way — a two-against-two split is not an alignment and is left off entirely.
Slower charts weigh more
The monthly read counts four times as much as the 4-hour one (4·3·2·1, monthly to 4-hour). Fast timeframes flip often and cost the most to act on once fees and spread are counted, so they are deliberately the quietest voice here.
Closed bars only
The bar still forming is discarded on every timeframe, so a reading cannot appear and vanish as a candle moves. The board is rebuilt at most every 15 minutes.
Every market, same test
The scan starts from every USDT market Binance.US lists — nothing is hand-picked. Markets trading under $10,000 a day are skipped, because a signal you cannot enter or exit is not a signal, and a coin without 21 months of history is left out until the monthly read exists. Each card shows its own 24-hour turnover.
What it deliberately is not
There is no volume test, no momentum oscillator, no pattern detection and no optimisation. A moving-average cross is one of the oldest and most widely known rules in the market, and it is known to perform poorly in sideways conditions, which crypto spends much of its time in.
What this board cannot tell you
Limits worth taking seriously
- 1Agreement is not expectancy. The grade counts how many timeframes currently agree. It is not derived from historical returns and carries no claim about how often such a reading has been right.
- 2No backtest, no track record. This rule has not been tested against history here, and nothing on this page reports past performance. Published studies of moving-average rules on crypto generally find the edge disappears once fees and spread are counted.
- 3Moving averages lag by design. Both EMAs are averages of prices that already happened, so alignment confirms a move that is already under way and is at its most complete near the end of one. In a sideways market this rule flips direction repeatedly and each flip costs fees and spread.
- 4The levels are not a plan. Entry, stop and targets are published, but no position size is — and on leveraged markets sizing drives the outcome far more than the levels do. How much to risk is specific to your capital, and this board knows nothing about it. The position size calculator will do that arithmetic, but only from numbers you supply, and it is not a recommendation to take the position.
- 5Acting on a bearish card is not the mirror of a bullish one. The prices here are ordinary spot markets. Going short means borrowed or leveraged exposure on some other venue, where losses can exceed your deposit and position sizing dominates outcomes far more than signal quality does.
Who this is and is not for
If you are building long-term wealth, this page is the wrong tool and mostly a distraction. Broad diversification, low costs and time do the work — none of which requires a signal board. Start with asset allocation →
If you already trade actively and understand derivatives risk, treat this as a screening tool: something that narrows a board of dozens of markets down to a handful worth your own analysis. It is the start of your research, never the end of it.